Getting Started
Build your first dashboard fast, then iterate with confidence.
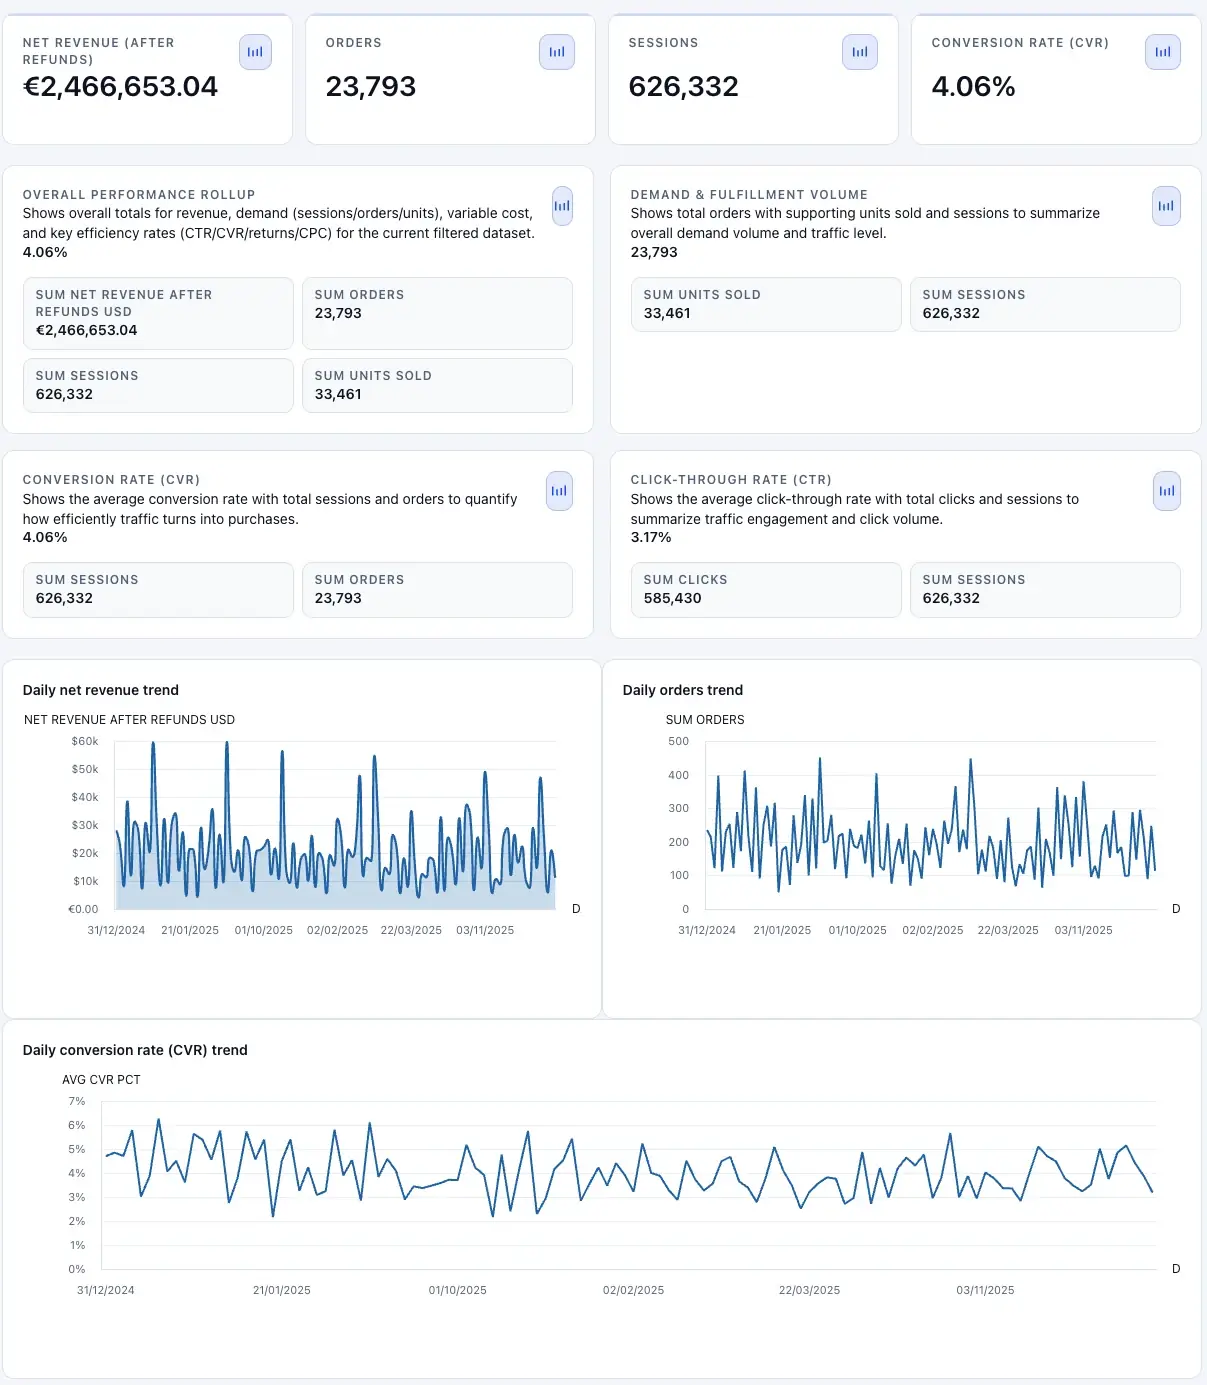
Typical generated output shown immediately after build completion.
Quick start (5 minutes)
- Open Builder and upload a dataset (or use sample data).
- Write one sentence describing the decision the dashboard should support.
- Start generation and watch the stage-by-stage progress.
- Open the dashboard when Ready. Validate with drilldowns.
- Share a view-only link or schedule refresh once it’s stable.
Upload supported datasets
Builder accepts CSV, Excel, TSV, and Parquet. You can drag-and-drop files or use the file picker.
If your file is Excel, optionally provide a sheet reference (for example, 0 or Sheet1) to target the exact worksheet.
- Maximum upload size in-app: 100 MB.
- Remove and replace attached files before starting generation.
- Use Try sample if you want to test the full workflow quickly.
Write a useful dashboard prompt
Describe what decision the dashboard should support, not just what charts you want. ClairInsights uses your intent to pick KPI cards, trends, and detailed tables.
Prompt examples
- Show campaign efficiency, spend trends, and top drivers by channel.
- Highlight conversion drop-offs by funnel stage and segment.
- Summarize warehouse inventory risk by status and aging buckets.
Track build progress and statuses
Builder displays stage-by-stage progress for Upload, Profiling, Privacy redaction, Planning, and Build.
In Dashboards, each item transitions through Queued, Processing, Ready, or Failed.
| Status | What it means | What to do |
|---|---|---|
| Queued | Waiting for processing resources. | Wait briefly, then refresh the list. If it persists, note the dashboard ID. |
| Processing | Generation is actively running. | Leave the job running; avoid restarting unless it’s stuck for a long time. |
| Ready | Open and interact immediately. | Validate KPIs, test filters, and share once stable. |
| Failed | Generation failed. | Simplify prompt, verify file/sheet targeting, and retry. Use Troubleshooting if needed. |
Use result actions after generation
After a successful build, open the dashboard, download HTML, open preview, or copy an open link.
From Dashboards, continue refinement with filters, layout edits, sharing, and data refresh uploads.
Understand privacy-by-default planning
During planning, ClairInsights uses column metadata and redacted samples. Raw rows are not sent during planning.
Only share sensitive values when operationally necessary, and prefer least-privilege datasets for initial runs.
Related guides
- Chat & Remix — ask questions and add widgets back to dashboards.
- Dashboard Workspace — edit layout, formatting, export, and sharing.
- FAQ — quick answers for credits, privacy, and sharing.