Explain changes fast
Ask focused questions and keep answers scoped to your current filters.
- Use "Using current dashboard filters" to keep context tight.
- Tool cards show query state + duration for each action.
Dashboard workspace
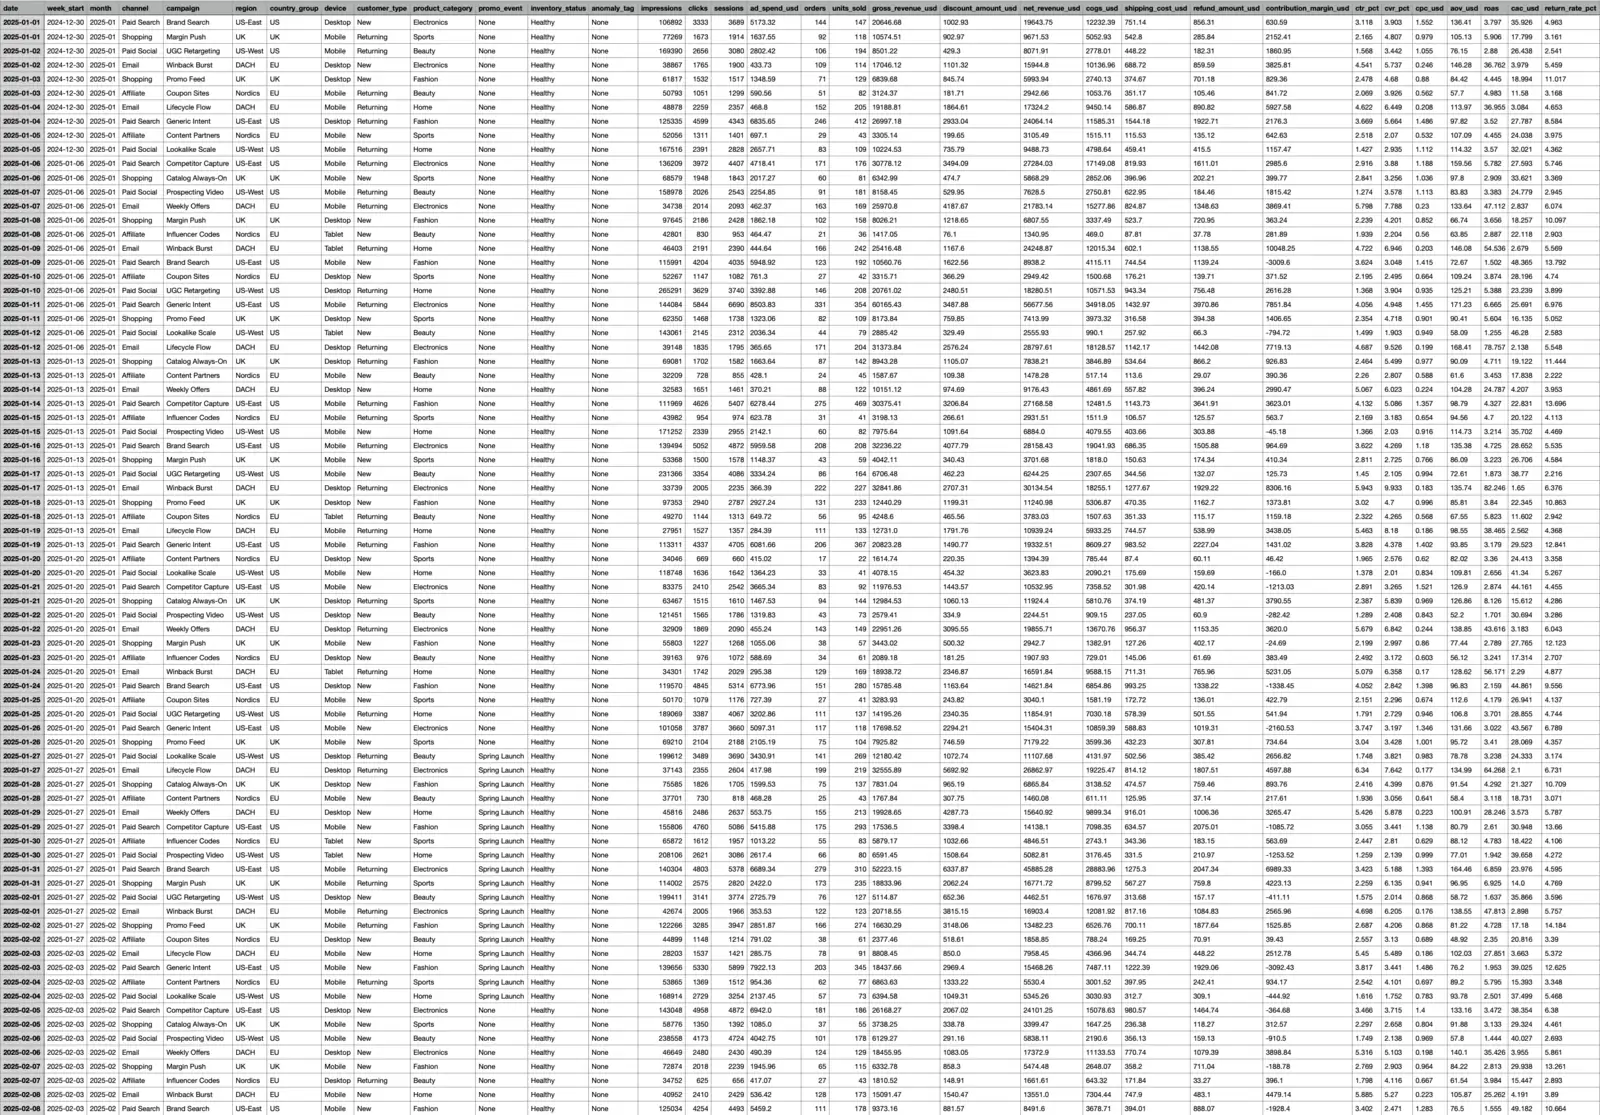
Upload CSV/Excel/TSV/Parquet or connect Google Sheets/SQL. Ask your data questions in chat, turn answers into dashboard tiles, then share one access‑controlled link and schedule updates.
Ask your data in chat.
Get instant explanations for what changed and why.
Turn answers into tiles.
Add charts and tables back to the dashboard with one click.
Share one link.
Invite, revoke, and keep access view‑only.
Schedule updates.
Refresh on a cadence with alerts to email or Slack.
Start with sample data if you don't want to upload anything yet.
Before → After
Drag to see what ClairInsights generates from the same dataset.
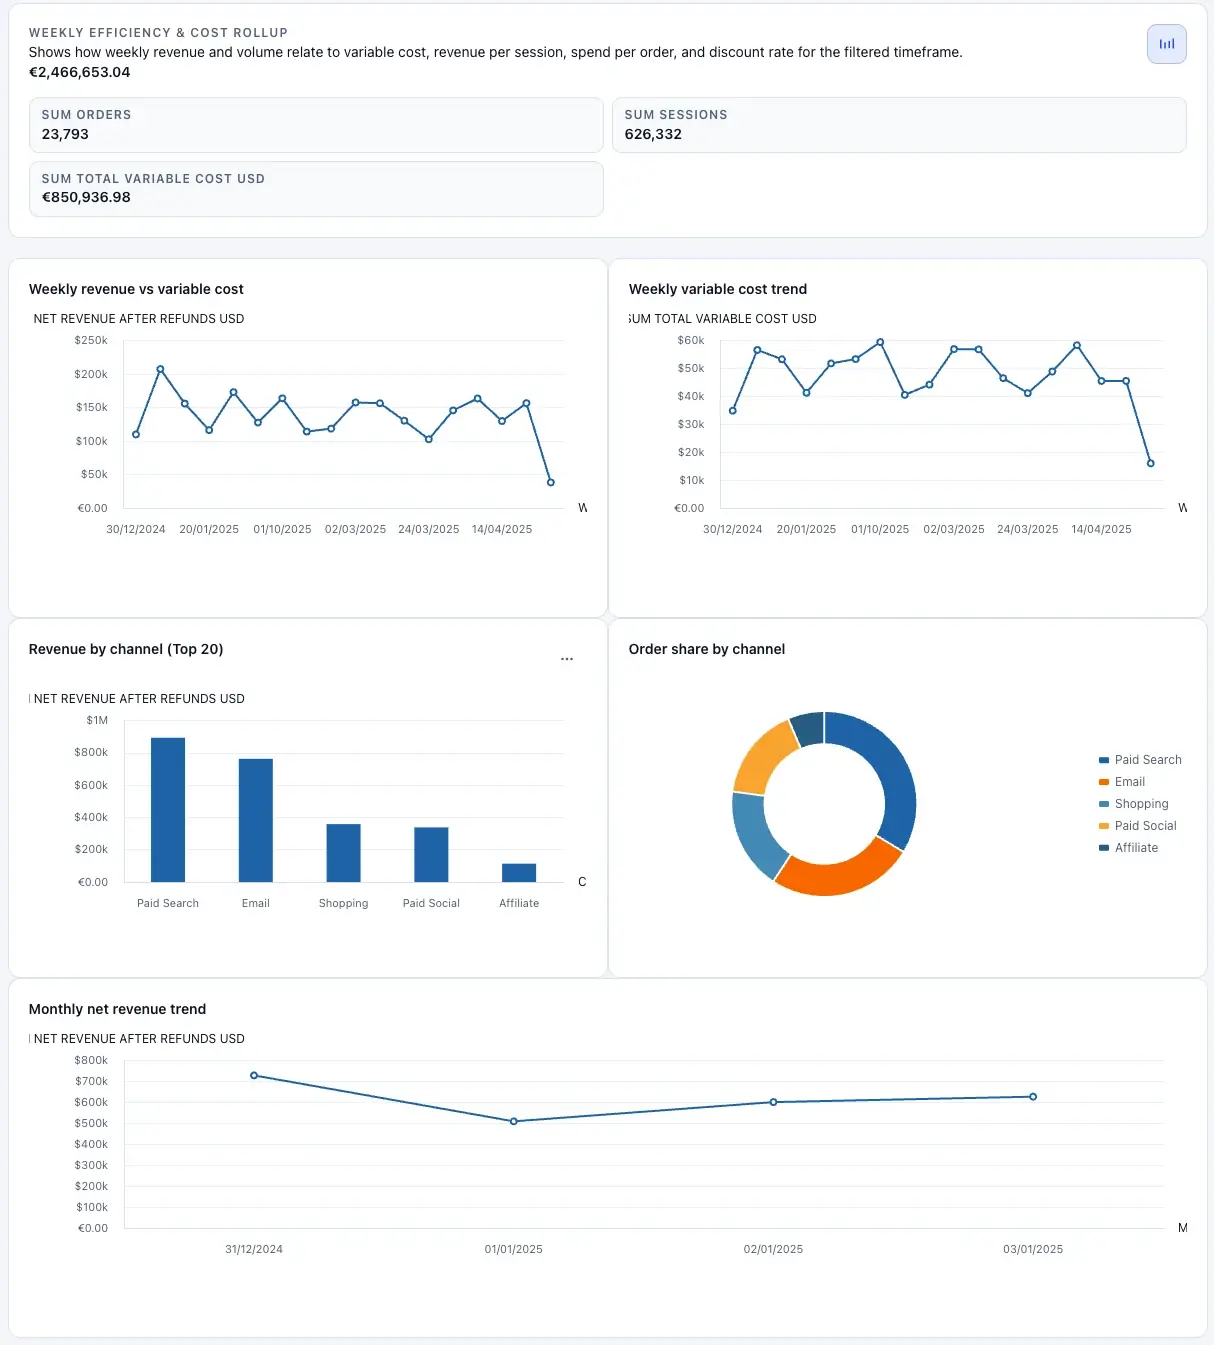
Same source. Clean KPIs, filters, charts, and drilldowns.
Ask in chat
Explore changes, find drivers, and add widgets back to the dashboard.
Example: Spend increased WoW, driven mostly by Paid Search in DACH. ROAS held steady because revenue rose with sessions.
What you get
Build from messy exports, validate with drilldowns, explain changes in chat, then share and automate.
Ask focused questions and keep answers scoped to your current filters.
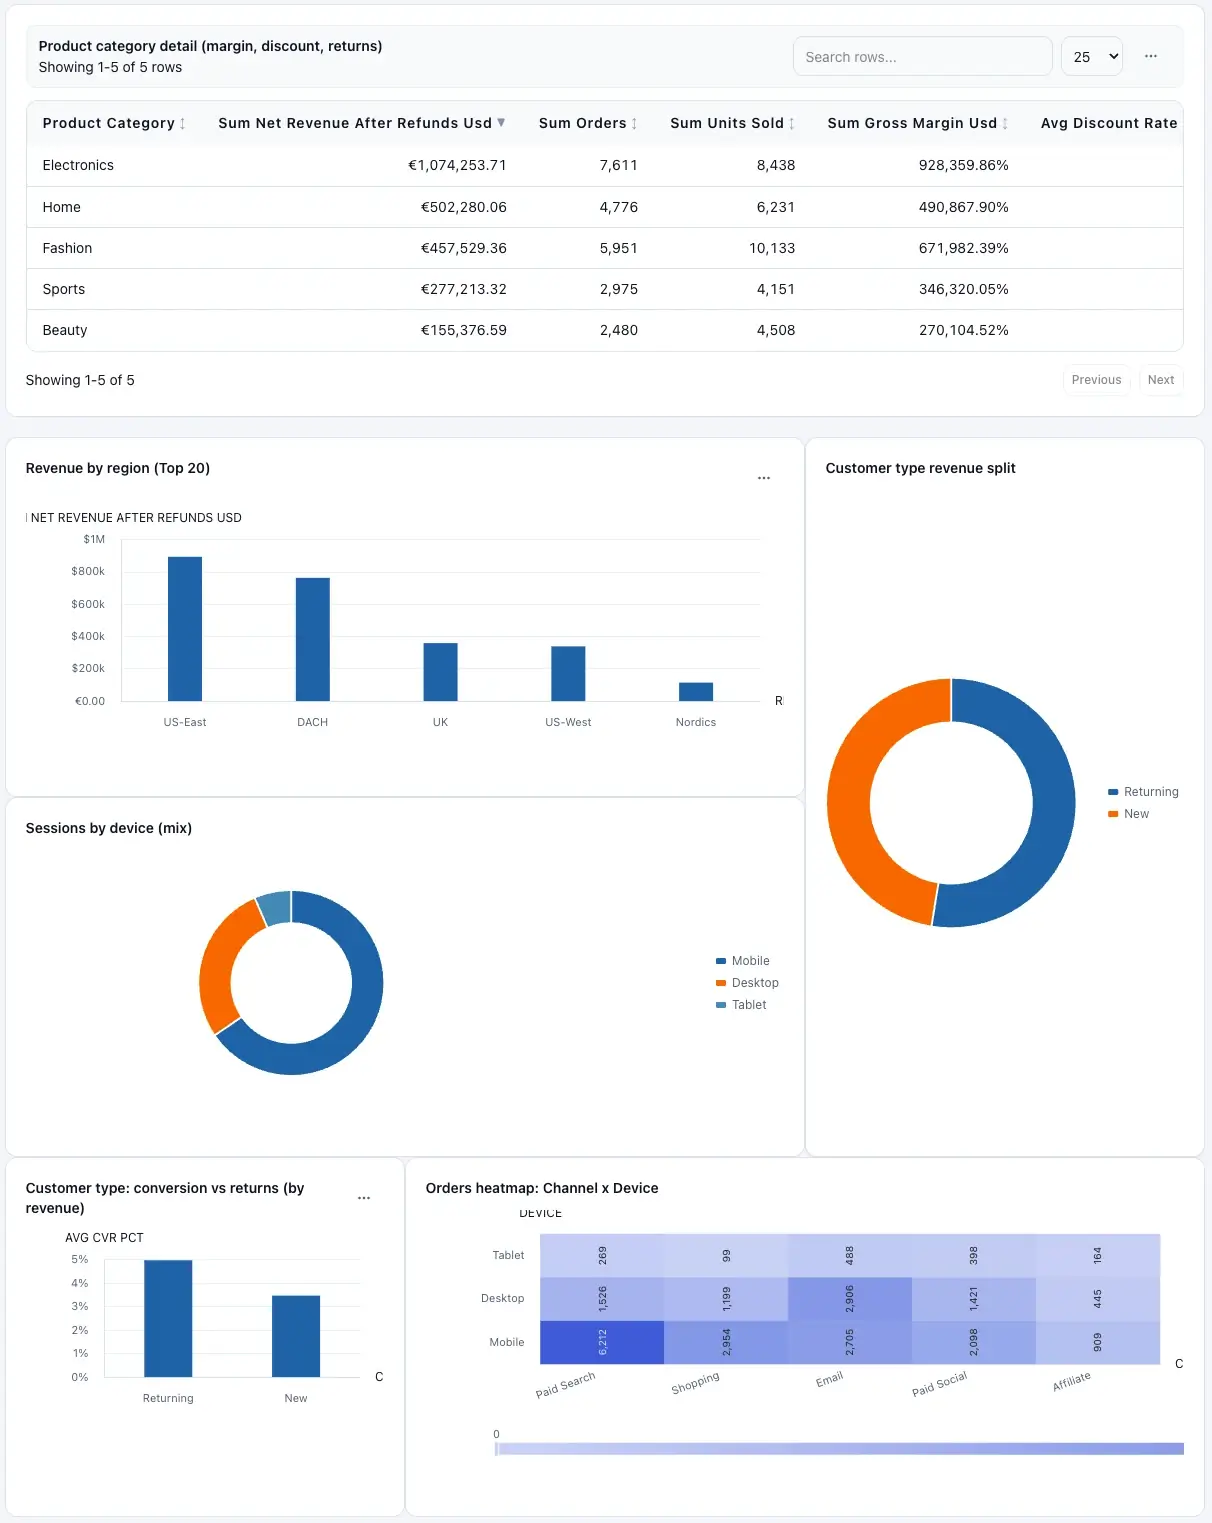
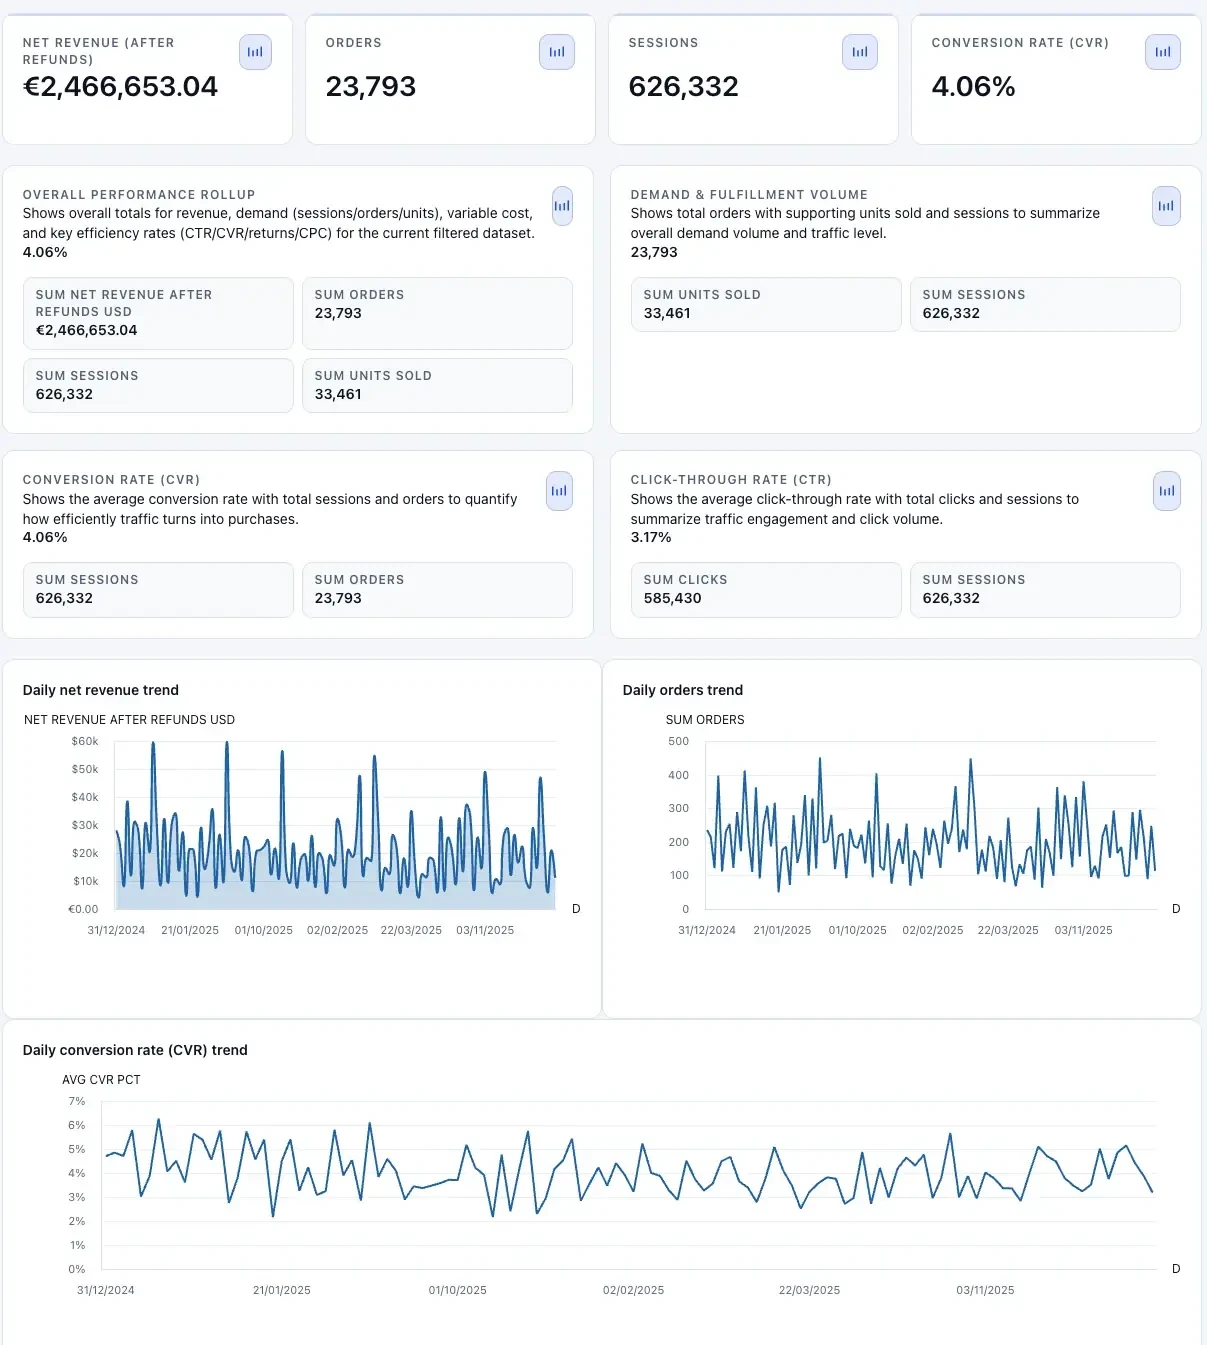
KPIs, trends, breakdowns, and drilldown tables generated from one source.
When chat suggests a chart or table, add it directly to the dashboard.
Connect governed sources and run reliable refresh workflows.
How it works
Connect data, describe the outcome you need, and get a dashboard that's ready to review and share.
Upload a file or connect a source like Google Sheets or SQL.
Write one sentence about the decision the dashboard should support.
Review KPIs and drilldowns, ask “what changed?” in chat, then share one link.
Exports
Export PDF for static reporting. Use HTML export for portable sharing.
Refresh
Run now or schedule recurring refreshes with timezone settings. Route alerts to email or Slack webhook.
Review in the app
Dashboards are generated quickly, then refined in a proper workspace so teams can validate structure before sharing.
Templates
Pick a template, connect data, then remix without breaking the original.
Why it matters: Spot wasted budget quickly and reallocate spend to what's working.
Open template →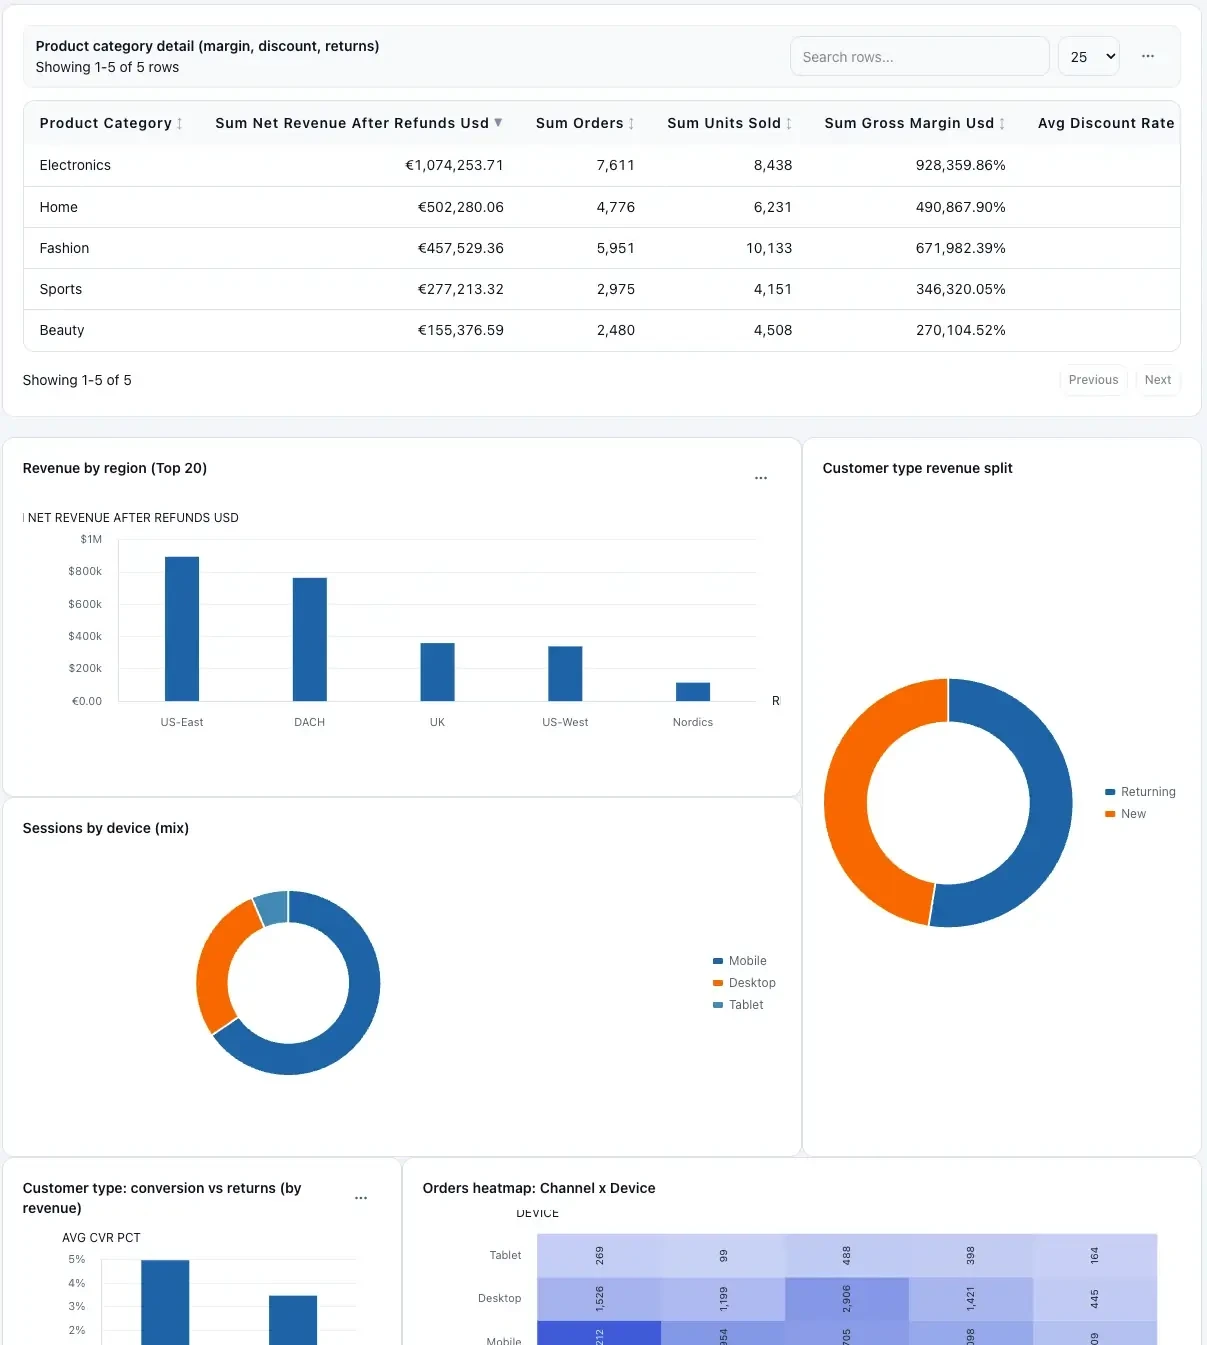
Why it matters: Prevent stockouts and catch bottlenecks before they escalate.
Open template →
Why it matters: Give leadership a shared view for faster decisions.
Open template →Security & privacy
Designed for teams working with sensitive operational data—without forcing a BI migration.
Security details (quick)
If you need deeper compliance info, email security@clairinsights.com.
Need security or compliance info?
Email our team. We don't need raw data to help—share only what's necessary.
Pricing
Every dashboard generation and dashboard edit uses one credit. Pick a monthly plan and add extra credit packs when needed.
Free
3 credits / month
Includes 2 dashboard builds and 1 edit every month.
$39/month
20 credits / month
For operators who ship dashboards weekly.
$199/month
100 credits / month
Built for teams running dashboard workflows at production volume.
FAQ
If you're evaluating ClairInsights, these are the questions that matter.
Upload one dataset, describe your goal, and move from raw exports to a dashboard + answers.
No credit card required to try. Free plan available.